Using the Indices of Deprivation as a Planning Tool in the Creative Industries
If you've ever written a funding application or designed a community arts programme, you've probably found yourself trying to explain why your work matters in a particular place. You know your community faces challenges, you see it in the young people you work with, hear it from partners, feel it in the room. But how do you translate that lived experience into the kind of evidence funders and partners want to see?
At Alira Arts, we regularly use the English Indices of Deprivation (IoD) to do exactly that. It's become one of our most valuable tools for research, planning, and building partnerships across the creative sector. And the good news? It's completely free, publicly available, and much easier to use than you might think.
The latest release, IoD25, was published in October 2025 and updates the 2019 data. This means you now have access to the most current picture of deprivation across England, with new indicators and enhanced methodology making it even more robust for evidencing need in your funding applications and programme planning.
How do you translate lived experience into the evidence funders want to see?"
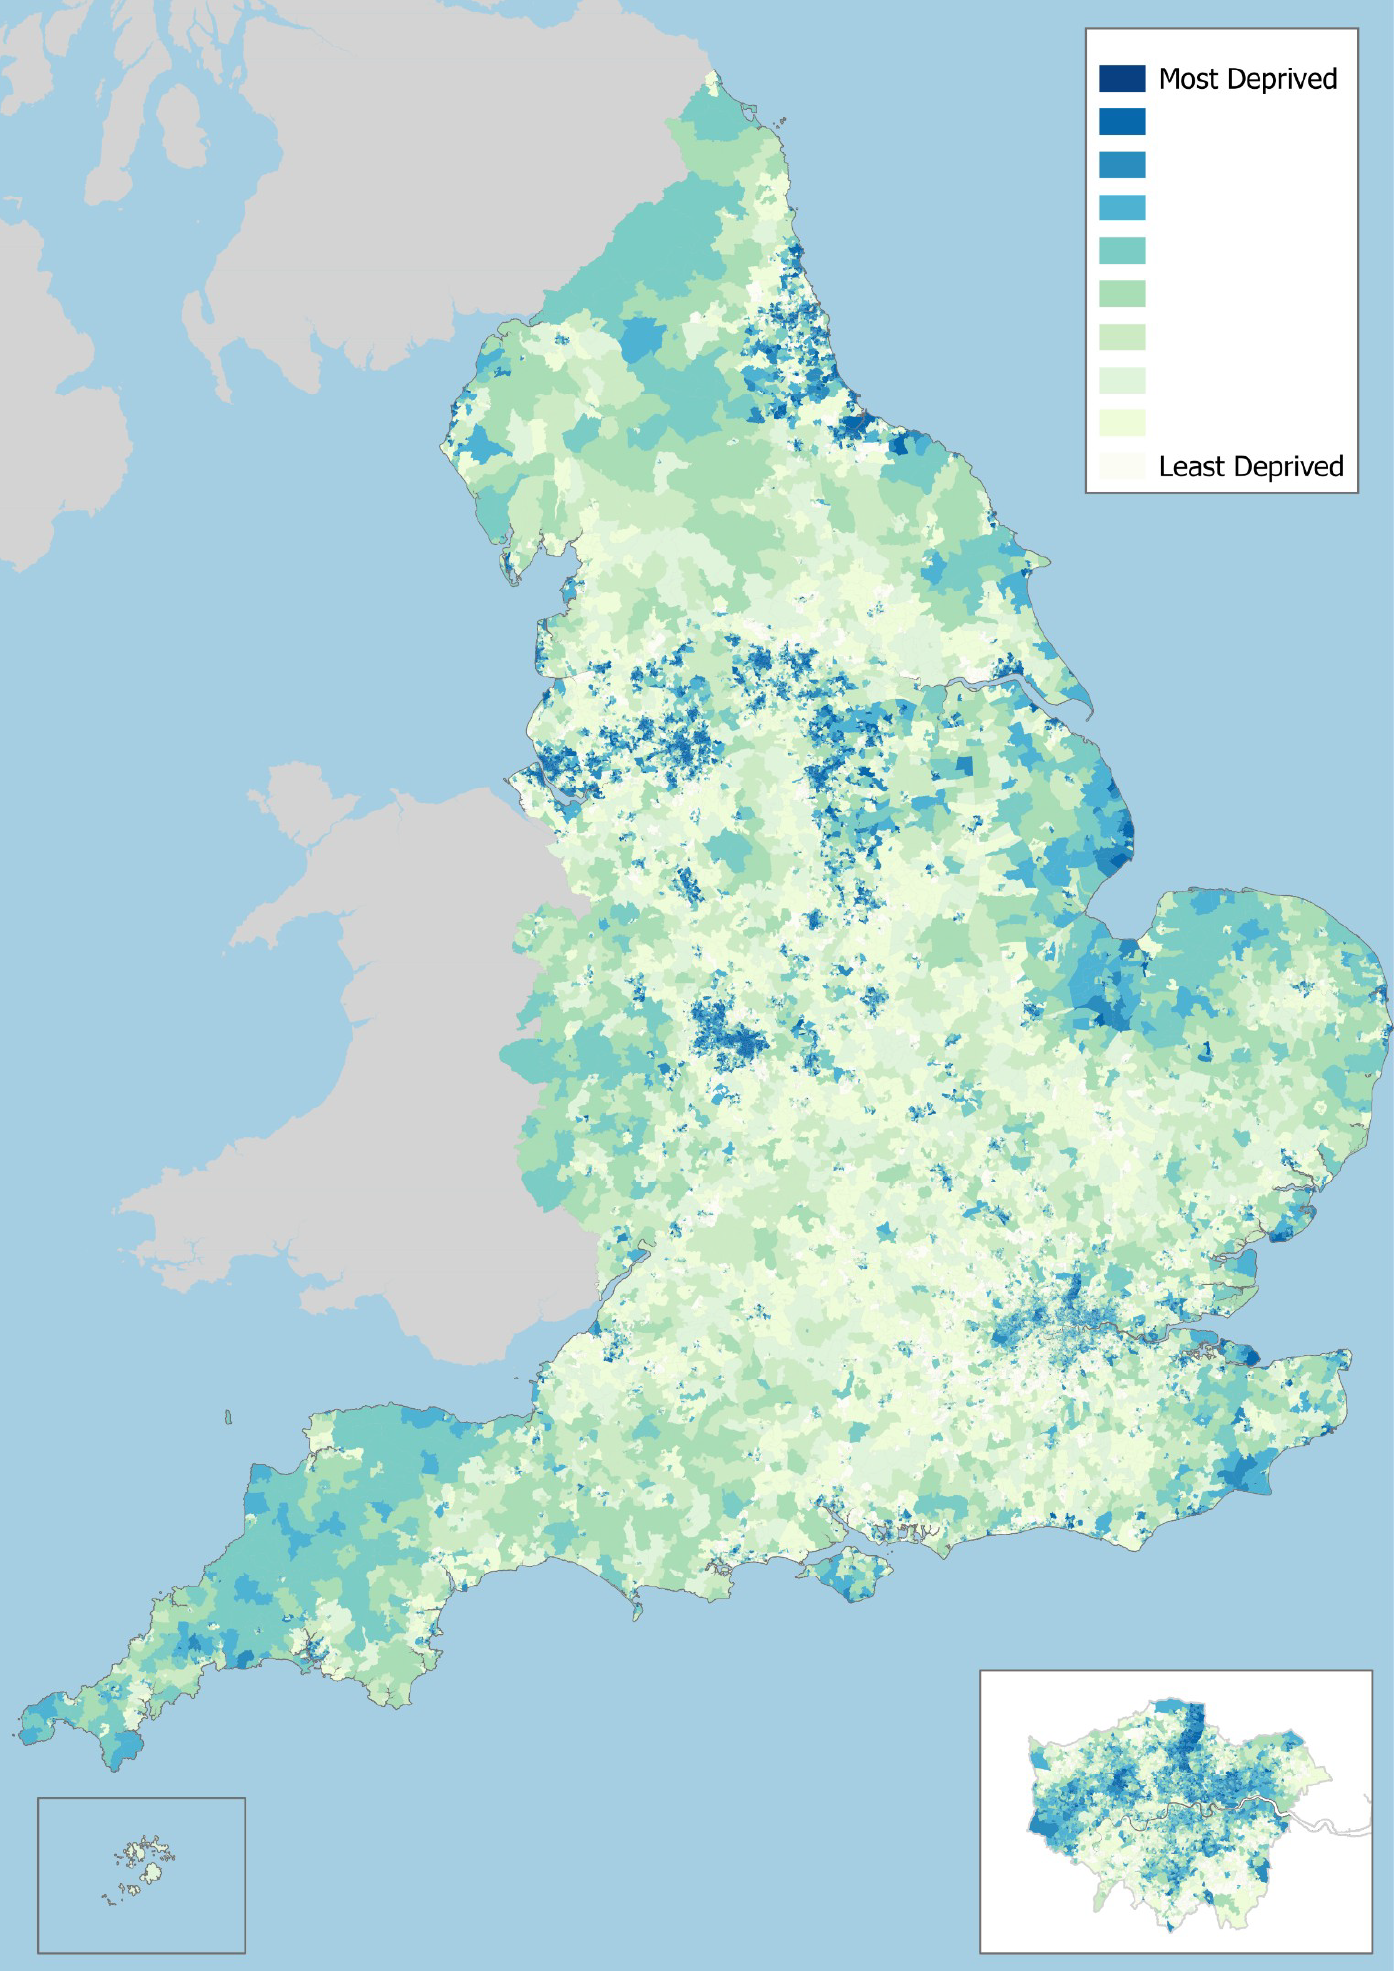
What Are the Indices of Deprivation?
The IoD25 are the UK government's official measure of relative deprivation across England. They rank every small neighbourhood (called Lower-layer Super Output Areas, or LSOAs, roughly 1,500 people each) from most to least deprived across seven different domains:
Income (22.5%)
Employment (22.5%)
Education, Skills and Training (13.5%)
Health (13.5%)
Crime (9.3%)
Barriers to Housing and Services (9.3%)
Living Environment (9.3%)
These combine to create the Index, the headline figure you'll see most often. But here's what makes this really useful: you can look at each domain separately, which means you can build a detailed picture of the specific challenges a community faces.
Why This Matters for Creative Work
Let's be honest: "Our community needs this" isn't enough for most funding applications anymore. Funders want evidence. Partners want data. And you need something more robust than anecdotal observations, no matter how accurate they are.
The IoD gives you that evidence. Here's how we use it:
Strengthening Funding Applications
Recently, we worked with an organisation in the West Midlands that runs a creative magazine and an arts journalism programme for young people. By using the IoD data, we were able to show that their target neighbourhoods weren't just "deprived" in a general sense, we could demonstrate specific, intersecting challenges:
High Income Deprivation Affecting Children (IDACI) scores showing significant child poverty
Employment Deprivation data revealing barriers to work opportunities for young adults
Education domain indicators highlighting skills gaps
Layering these indices together painted a complete picture of why a programme focused on developing writing, communication, and media skills wasn't just "nice to have" – it was directly responding to documented local needs. The data helped us connect programme outcomes (skills development, confidence building, pathways to employment) to measurable community challenges.
Building Strategic Partnerships
When you can say "32% of working-age adults in this area are employment-deprived" (rather than "unemployment is high"), you're speaking the language of local authorities, regeneration agencies, and other strategic partners. The IoD gives you that specificity.
It also helps identify which partners might be most relevant. High scores in Barriers to Housing? Housing associations become obvious allies. Crime domain challenges? Youth services and community safety teams. The data helps you target your partnership development more strategically.
Locating Where Activity Is Most Needed
Not sure where to focus your next project? The IoD can help you identify areas of greatest need within your region. This is particularly useful if you're working at a local authority level or across multiple neighbourhoods – you can prioritise resources where they'll have most impact.

Layering indices together shows why creative programmes aren't just 'nice to have', they respond to documented needs.
How to Access the Data (It's Easier Than You Think)
This is where it gets practical. The government has created an incredibly user-friendly tool called the Local Deprivation Explorer: https://deprivation.communities.gov.uk
Here's how we use it:
Enter your postcode or area name in the search box
View your area's profile, you'll immediately see the IMD rank and decile (the overall deprivation score)
Explore individual domains, click through to see Employment, Education, Income, Health, etc.
Compare to national averages, the tool shows you whether your area is in the most deprived 10%, 20%, etc. nationally
Download the data, you can export specific figures to include in applications and reports
No spreadsheets. No statistical knowledge required. Just straightforward data you can use immediately.
What People Often Discover
The most common "aha" moment we see? "This explains why our participants face X challenge."
You might have noticed patterns – young people struggling to find work experience, families unable to access certain opportunities, complex needs that seem to cluster together. The IoD often confirms what you've observed anecdotally and gives you the evidence base to act on it.
Sometimes the data surprises people, too. An area might look relatively prosperous on the surface but have pockets of significant deprivation. Or you might discover that while overall IMD scores are moderate, specific domains (like child poverty or employment) are particularly acute.
Making It Work for You: Practical Tips
Start with your area: Type your postcode into the Explorer and just have a look around. Familiarise yourself with the data before you need it for an application.
Focus on relevant domains: You don't need to cite all seven. If you're running employability workshops, focus on Employment Deprivation. Working with young people? IDACI and Education domains are your friends.
Use specific language: Instead of "a deprived area," try "an area in the most deprived 10% nationally for employment" or "where 40% of children live in income-deprived households." Precision matters.
Cite your source: Always reference the IoD25 when using this data. It's an Accredited Official Statistic, which adds weight to your applications.
Layer multiple indices: The most compelling cases often combine several domains to show intersecting challenges – just like our West Midlands example with IDACI + Employment + Education.
Where to Go From Here
We'd encourage you to spend 15 minutes exploring the data for your area. Type your postcode into https://deprivation.communities.gov.uk and see what comes up. You might be surprised by what you find – and how useful it could be for your next funding bid, partnership pitch, or programme design.
We're currently developing a more detailed training session on using IoD data alongside other research tools like Census data for cultural planning and funding applications. If you found this useful and would like to know when that's available, drop us a line or watch this space.
The Indices of Deprivation aren't just government statistics – they're a practical tool that helps us demonstrate why creative and cultural work matters where it matters most. Once you start using them, you'll wonder how you managed without them.
Keep Reading


